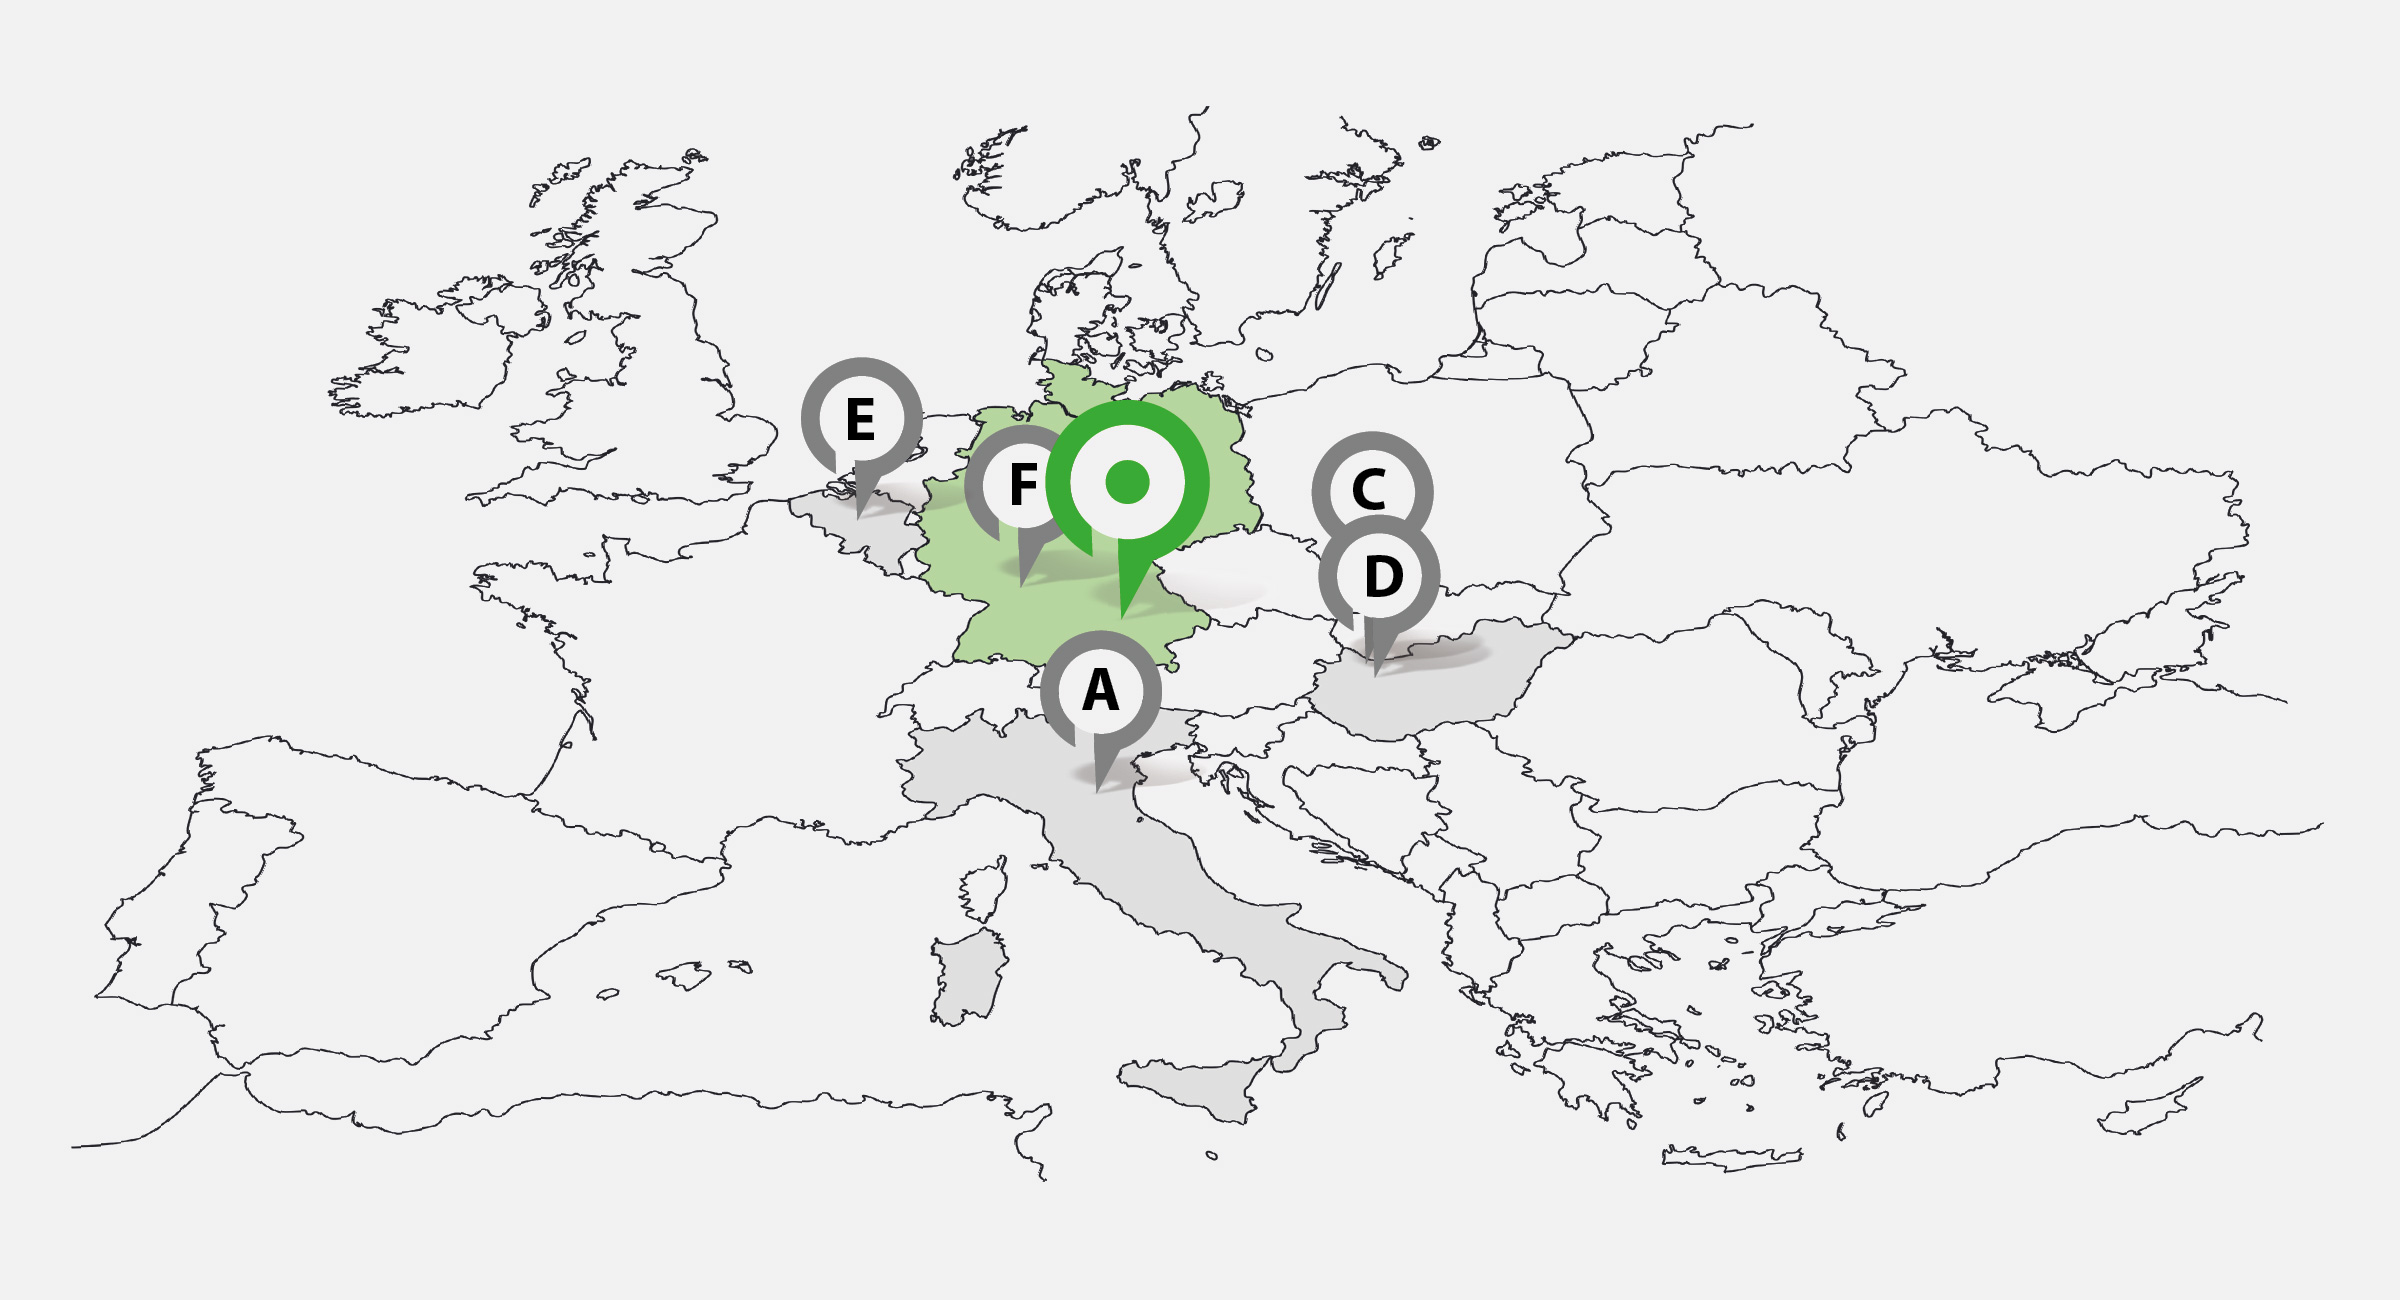
Location of the Oak Nelder Forest
Our Nelder plots use a striking radial layout where trees grow at varying distances from each other. This lets us observe how spacing and competition shape tree growth under real-world conditions.
Spanning a natural climate gradient from rainy Belgium to dry Italy, the sites expose trees to a wide range of environmental stress. This helps us uncover how forests might respond to future drought and climate change.
It’s a bold experiment: one design, many climates, and deep insight into forest resilience.
🌍 Experimental Site Map
Site Overview
We’re currently developing a interactive overview page providing information on each site. See site overview below.
Stay tuned — more information on the sites coming soon!
| Site | Country | Code | Mean Annual Temperature (°C) | Mean Annual Precipitation (mm) | Elevation (m a.s.l.) |
|---|---|---|---|---|---|
| Brussels | Belgium | BRU | 11.50 | 854 | 130 |
| Ingolstadt | Germany | ING | 9.58 | 728 | 460 |
| Neckarsulm | Germany | NEC | 14.70 | 762 | 25 |
| Sant’Agata | Italy | SAN | 10.70 | 642 | 380 |
| Györ 1 | Hungary | GYO1 | 11.90 | 592 | 110 |
| Györ 2 | Hungary | GYO2 | 11.90 | 592 | 110 |
The Oak Forest Nelder Design
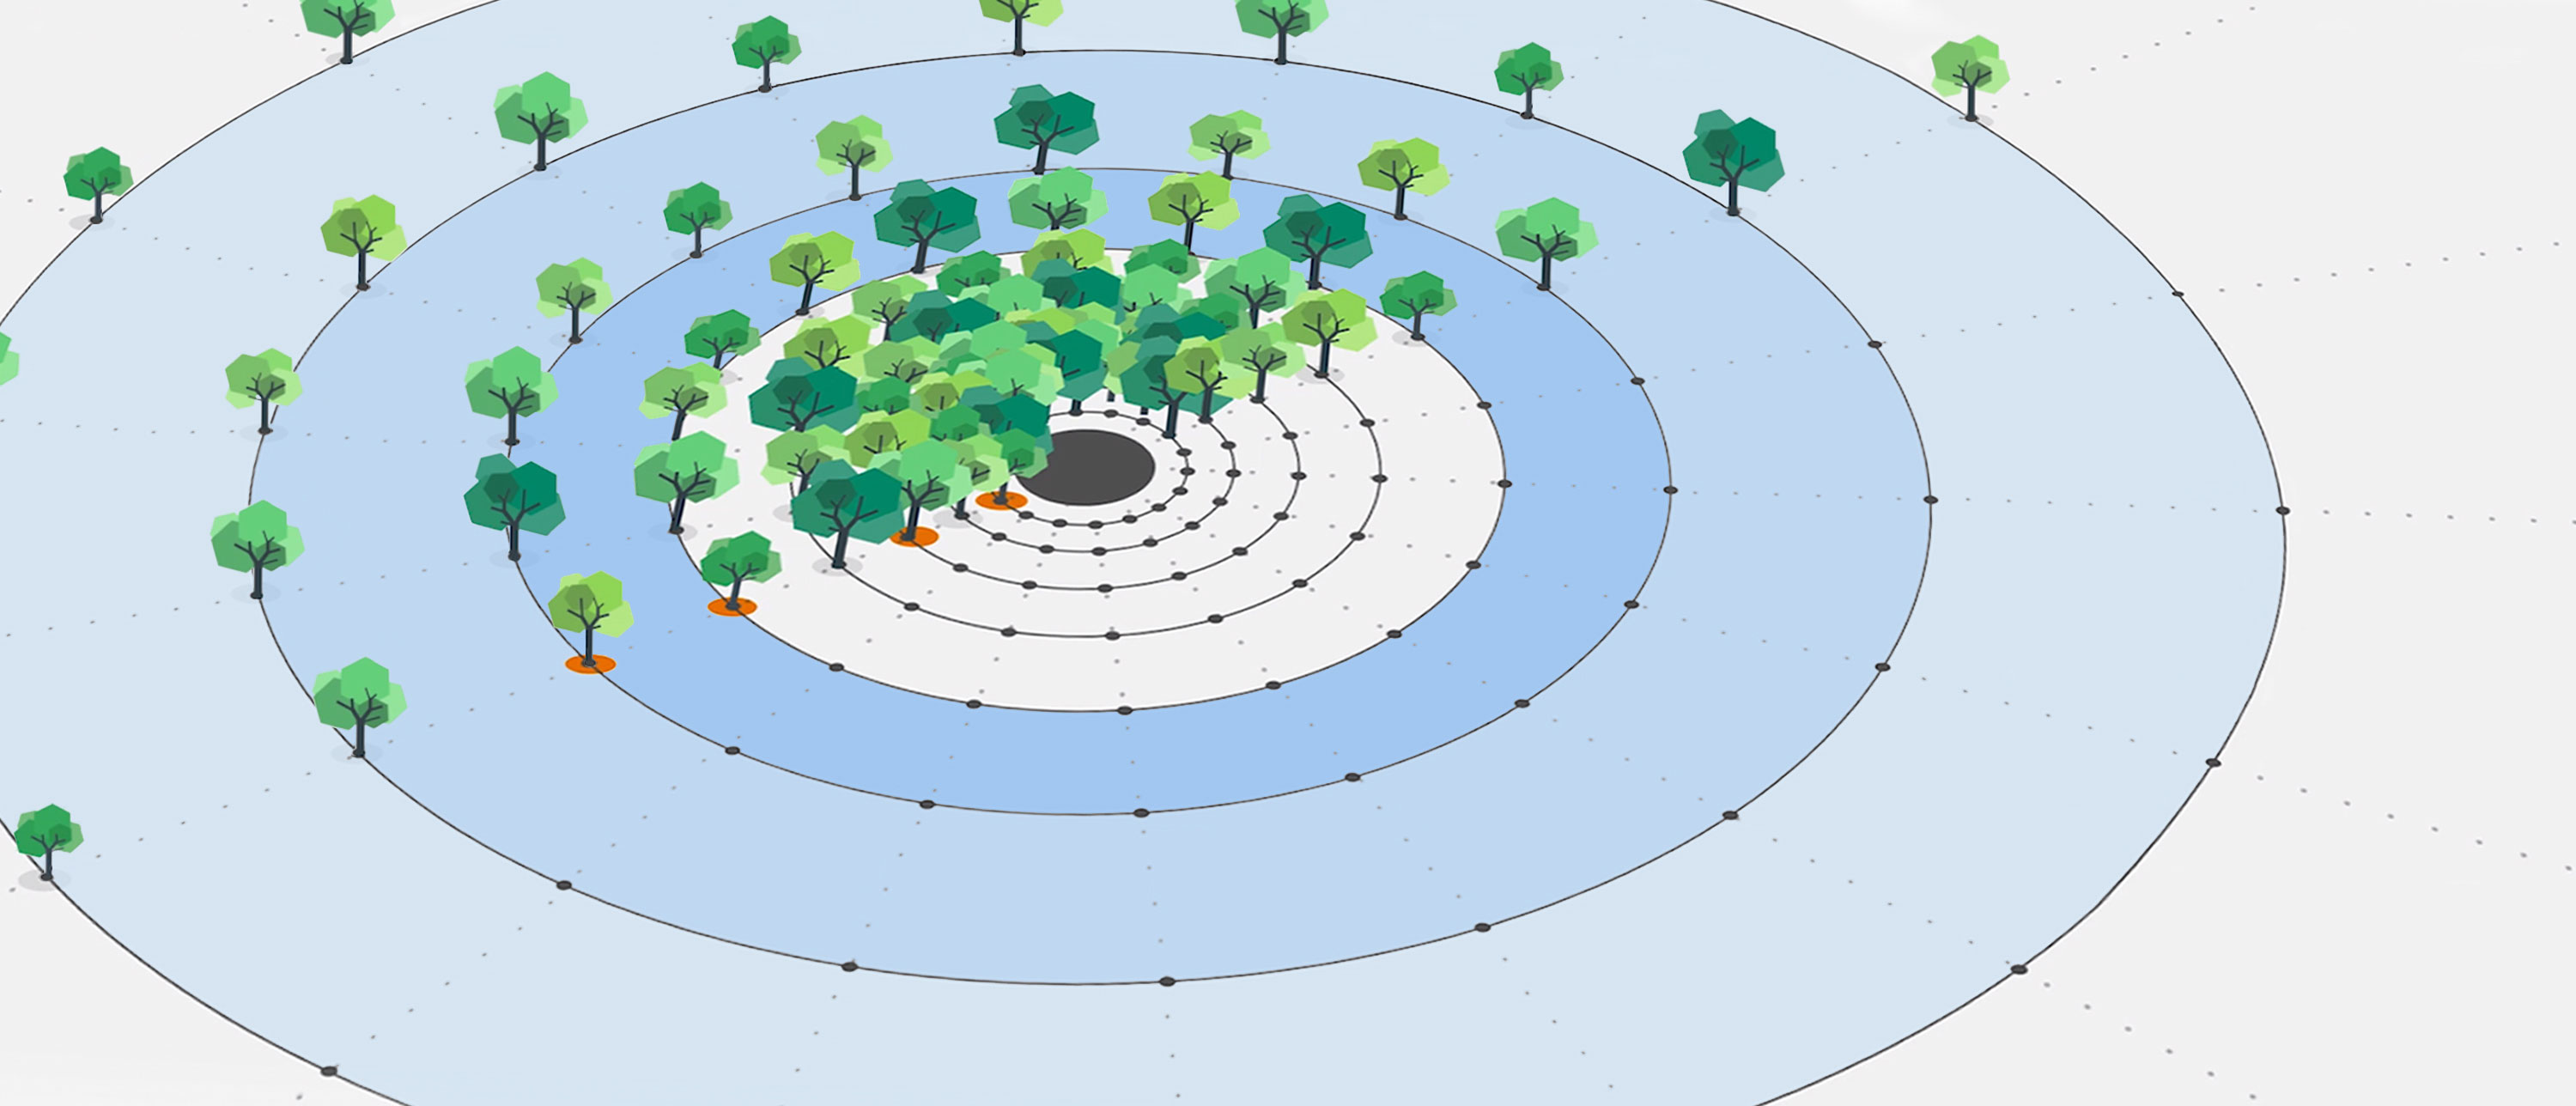
Wheels, Circles and Spokes
Our experimental oak forests are planted with intention: trees are spaced at varying distances to create a gradient from dense woodland to open, park-like conditions. While all trees experience the same climate, their growing space and neighbor interactions differ from just 40 cm apart to over 14 meters.
This unique design, based on the Nelder wheel concept from 1962, allows us to study how tree growth, carbon storage, and biodiversity respond to planting density (link). By observing trees in different social settings, we uncover how they compete for space, light, and water and which conditions support the most resilient forests.
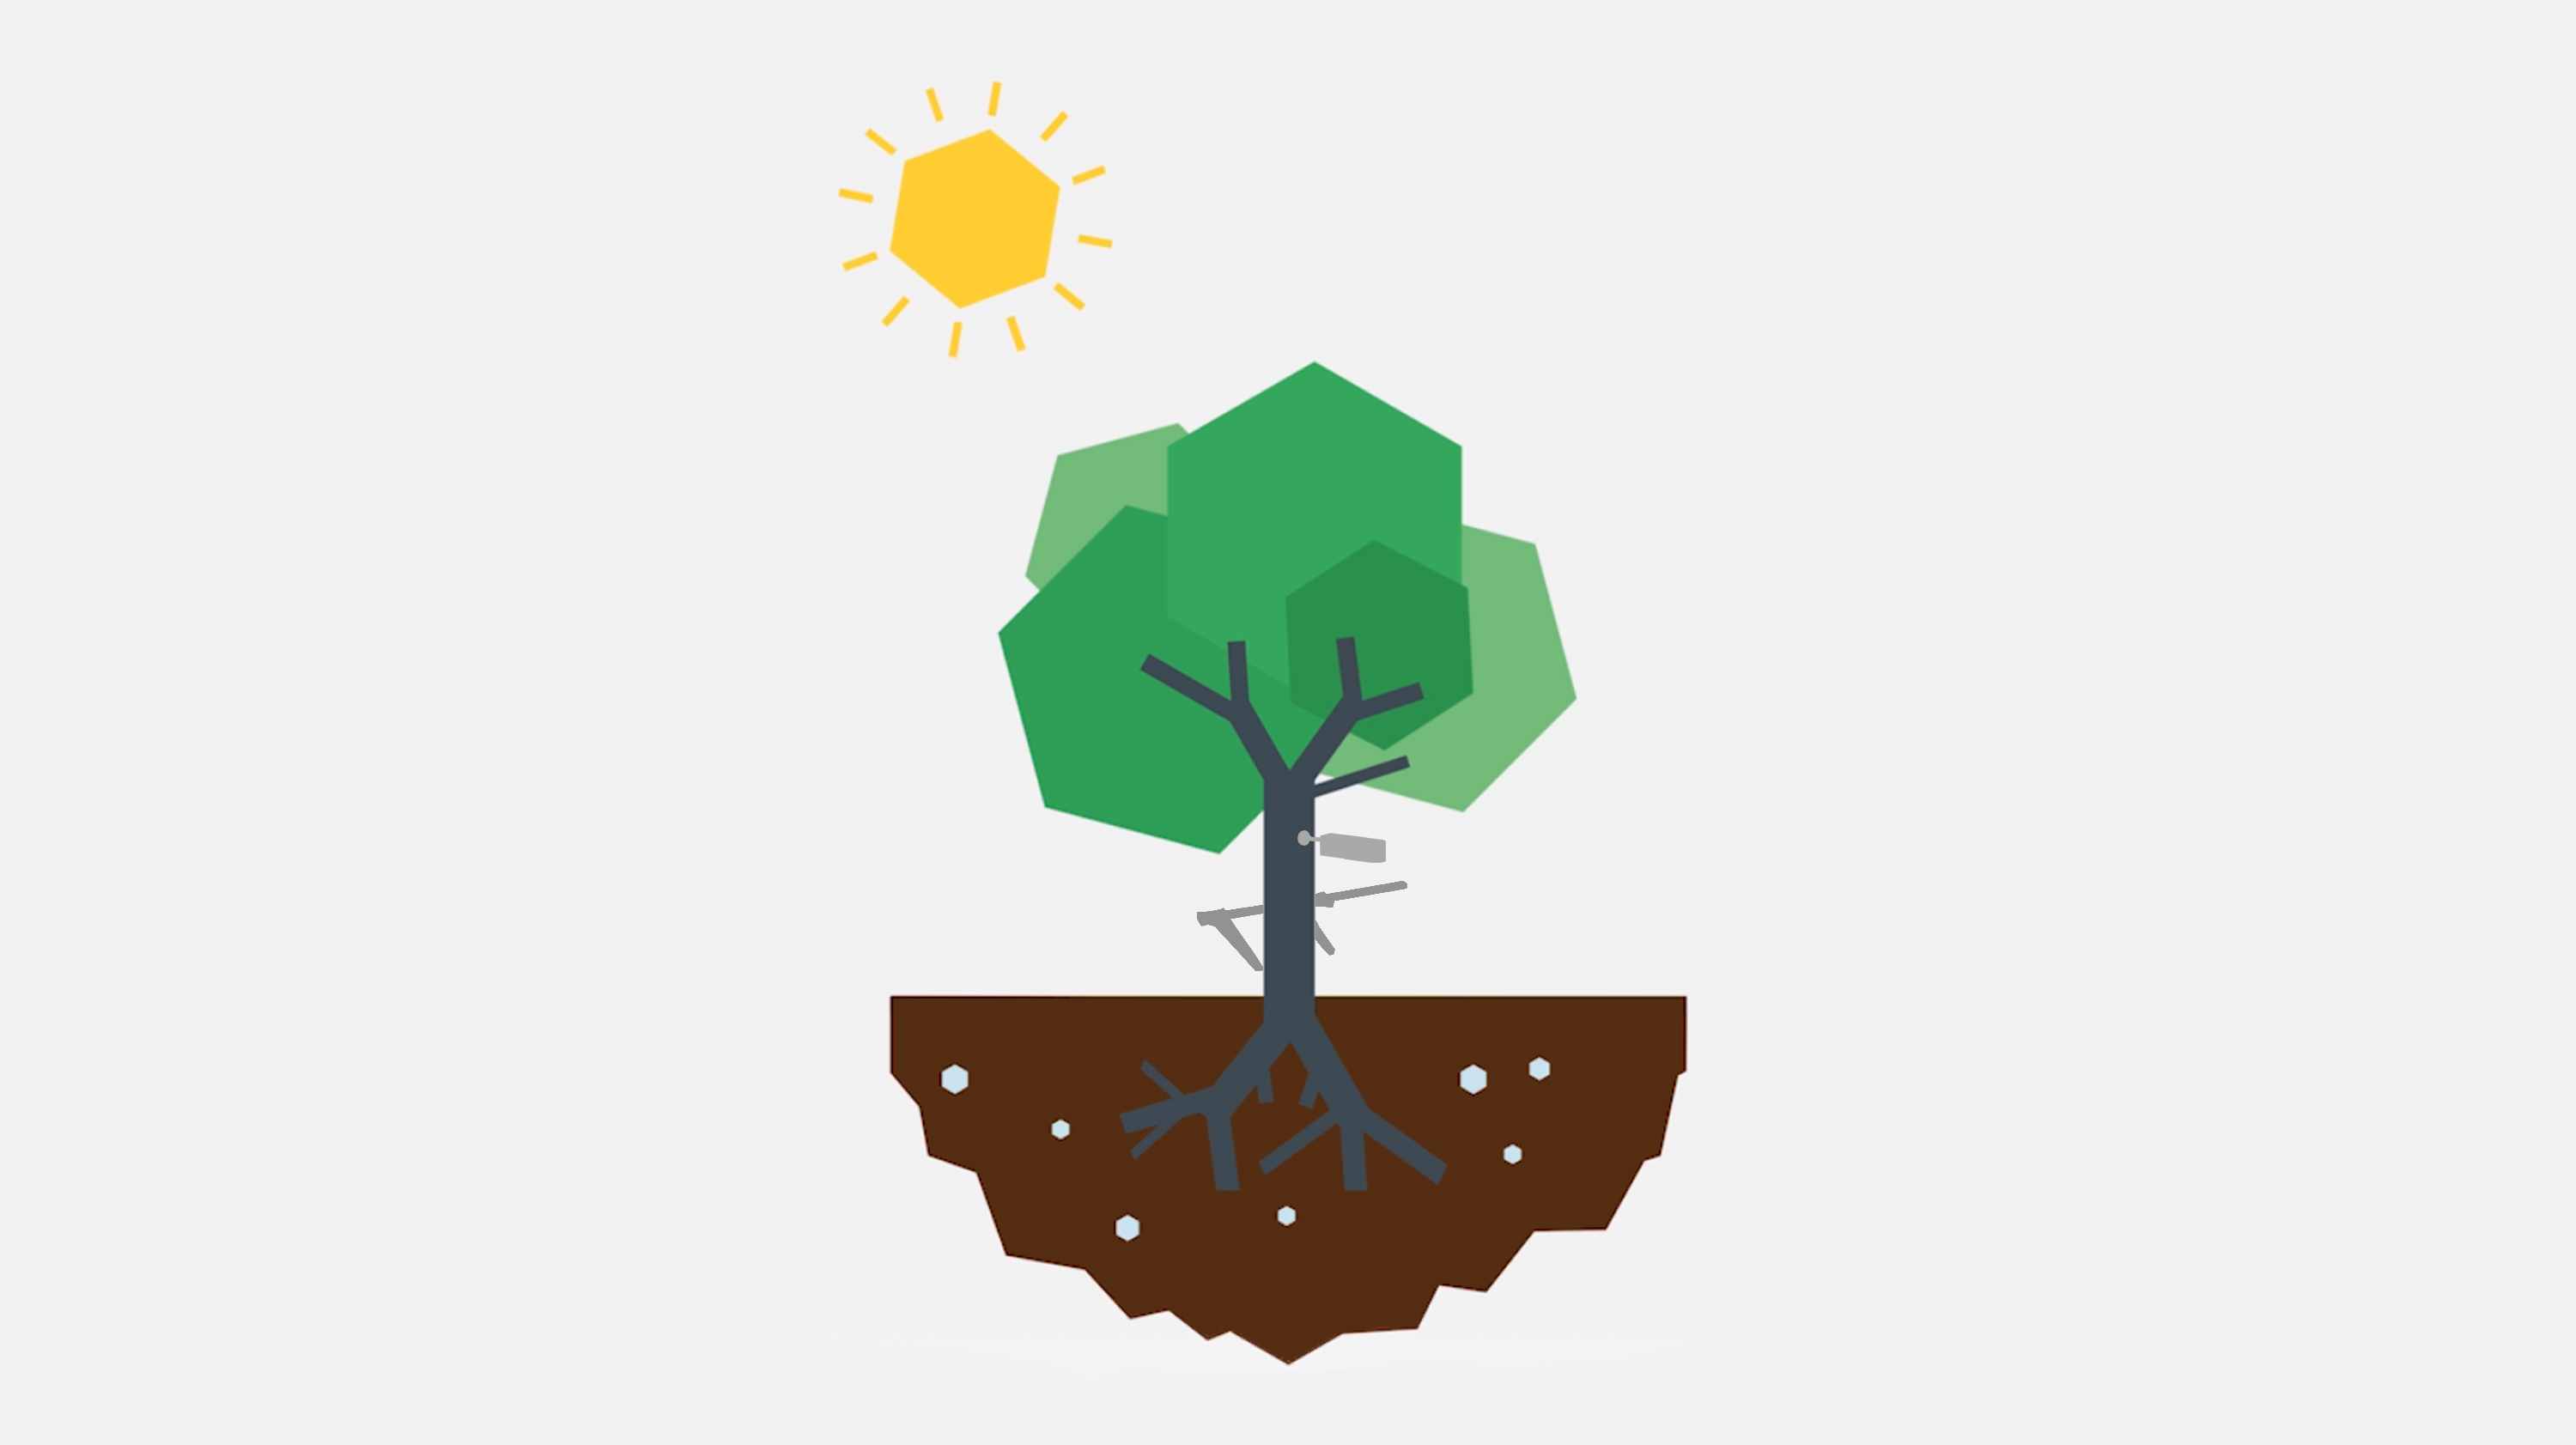
Tree Sensing
In spring 2025, we installed high-precision dendrometers on selected oak trees at our Ingolstadt site to monitor real-time growth dynamics.
Sensors were placed at breast height (1.3 m) on trees with a minimum diameter of 6 cm ensuring a stable surface for installation. To get a representative picture of growth, we chose co-dominant trees, not the largest, but those that reflect the average condition of the stand. Two sensors were installed on each circle of the Nelder plot, excluding the innermost and outermost rings. This setup allows us to track how growth responds to differences in spacing and environmental conditions one tree ring at a time.
Climate Gradient
To understand how oak forests respond to different climates, we established five experimental Nelder plots across four Central European countries, namely Belgium, Germany, Hungary and Italy. Each site was planted with 504 oak trees (Quercus robur) between 2008 and 2012, using the same wheels, circles and spokes but under very different environmental conditions.
Together, these sites form a climate gradient, ranging from humid Atlantic conditions in Brussels, to continental climates in Győr, and Mediterranean influences in Sant’Agata near Bologna. Annual precipitation varies from 592 mm to 854 mm, while average temperatures span from 9.6°C (Ingolstadt) to 14.7°C (Sant’Agata). This natural variation allows us to study how climate, soil, and aridity affect tree growth, survival, reproduction, and stress, helping us better understand what makes forests resilient under changing conditions.