Smart Forests: Our Monitoring Toolkit
At our Nelder plots, we’re measuring how trees grow, compete, and respond to their environment with precision. By combining traditional monitoring with novel sensor technologies, we track tree diameter, soil moisture, temperature, and humidity in real time.
These high-resolution measurements allow us to understand how trees react to drought, space, and competition. With data from thousands of trees, we’re building a detailed picture of forest dynamics, and how they may shift in a changing climate.
Using next-generation sensors to decode the living dynamics of trees, one data point at a time.
Measurements We Take
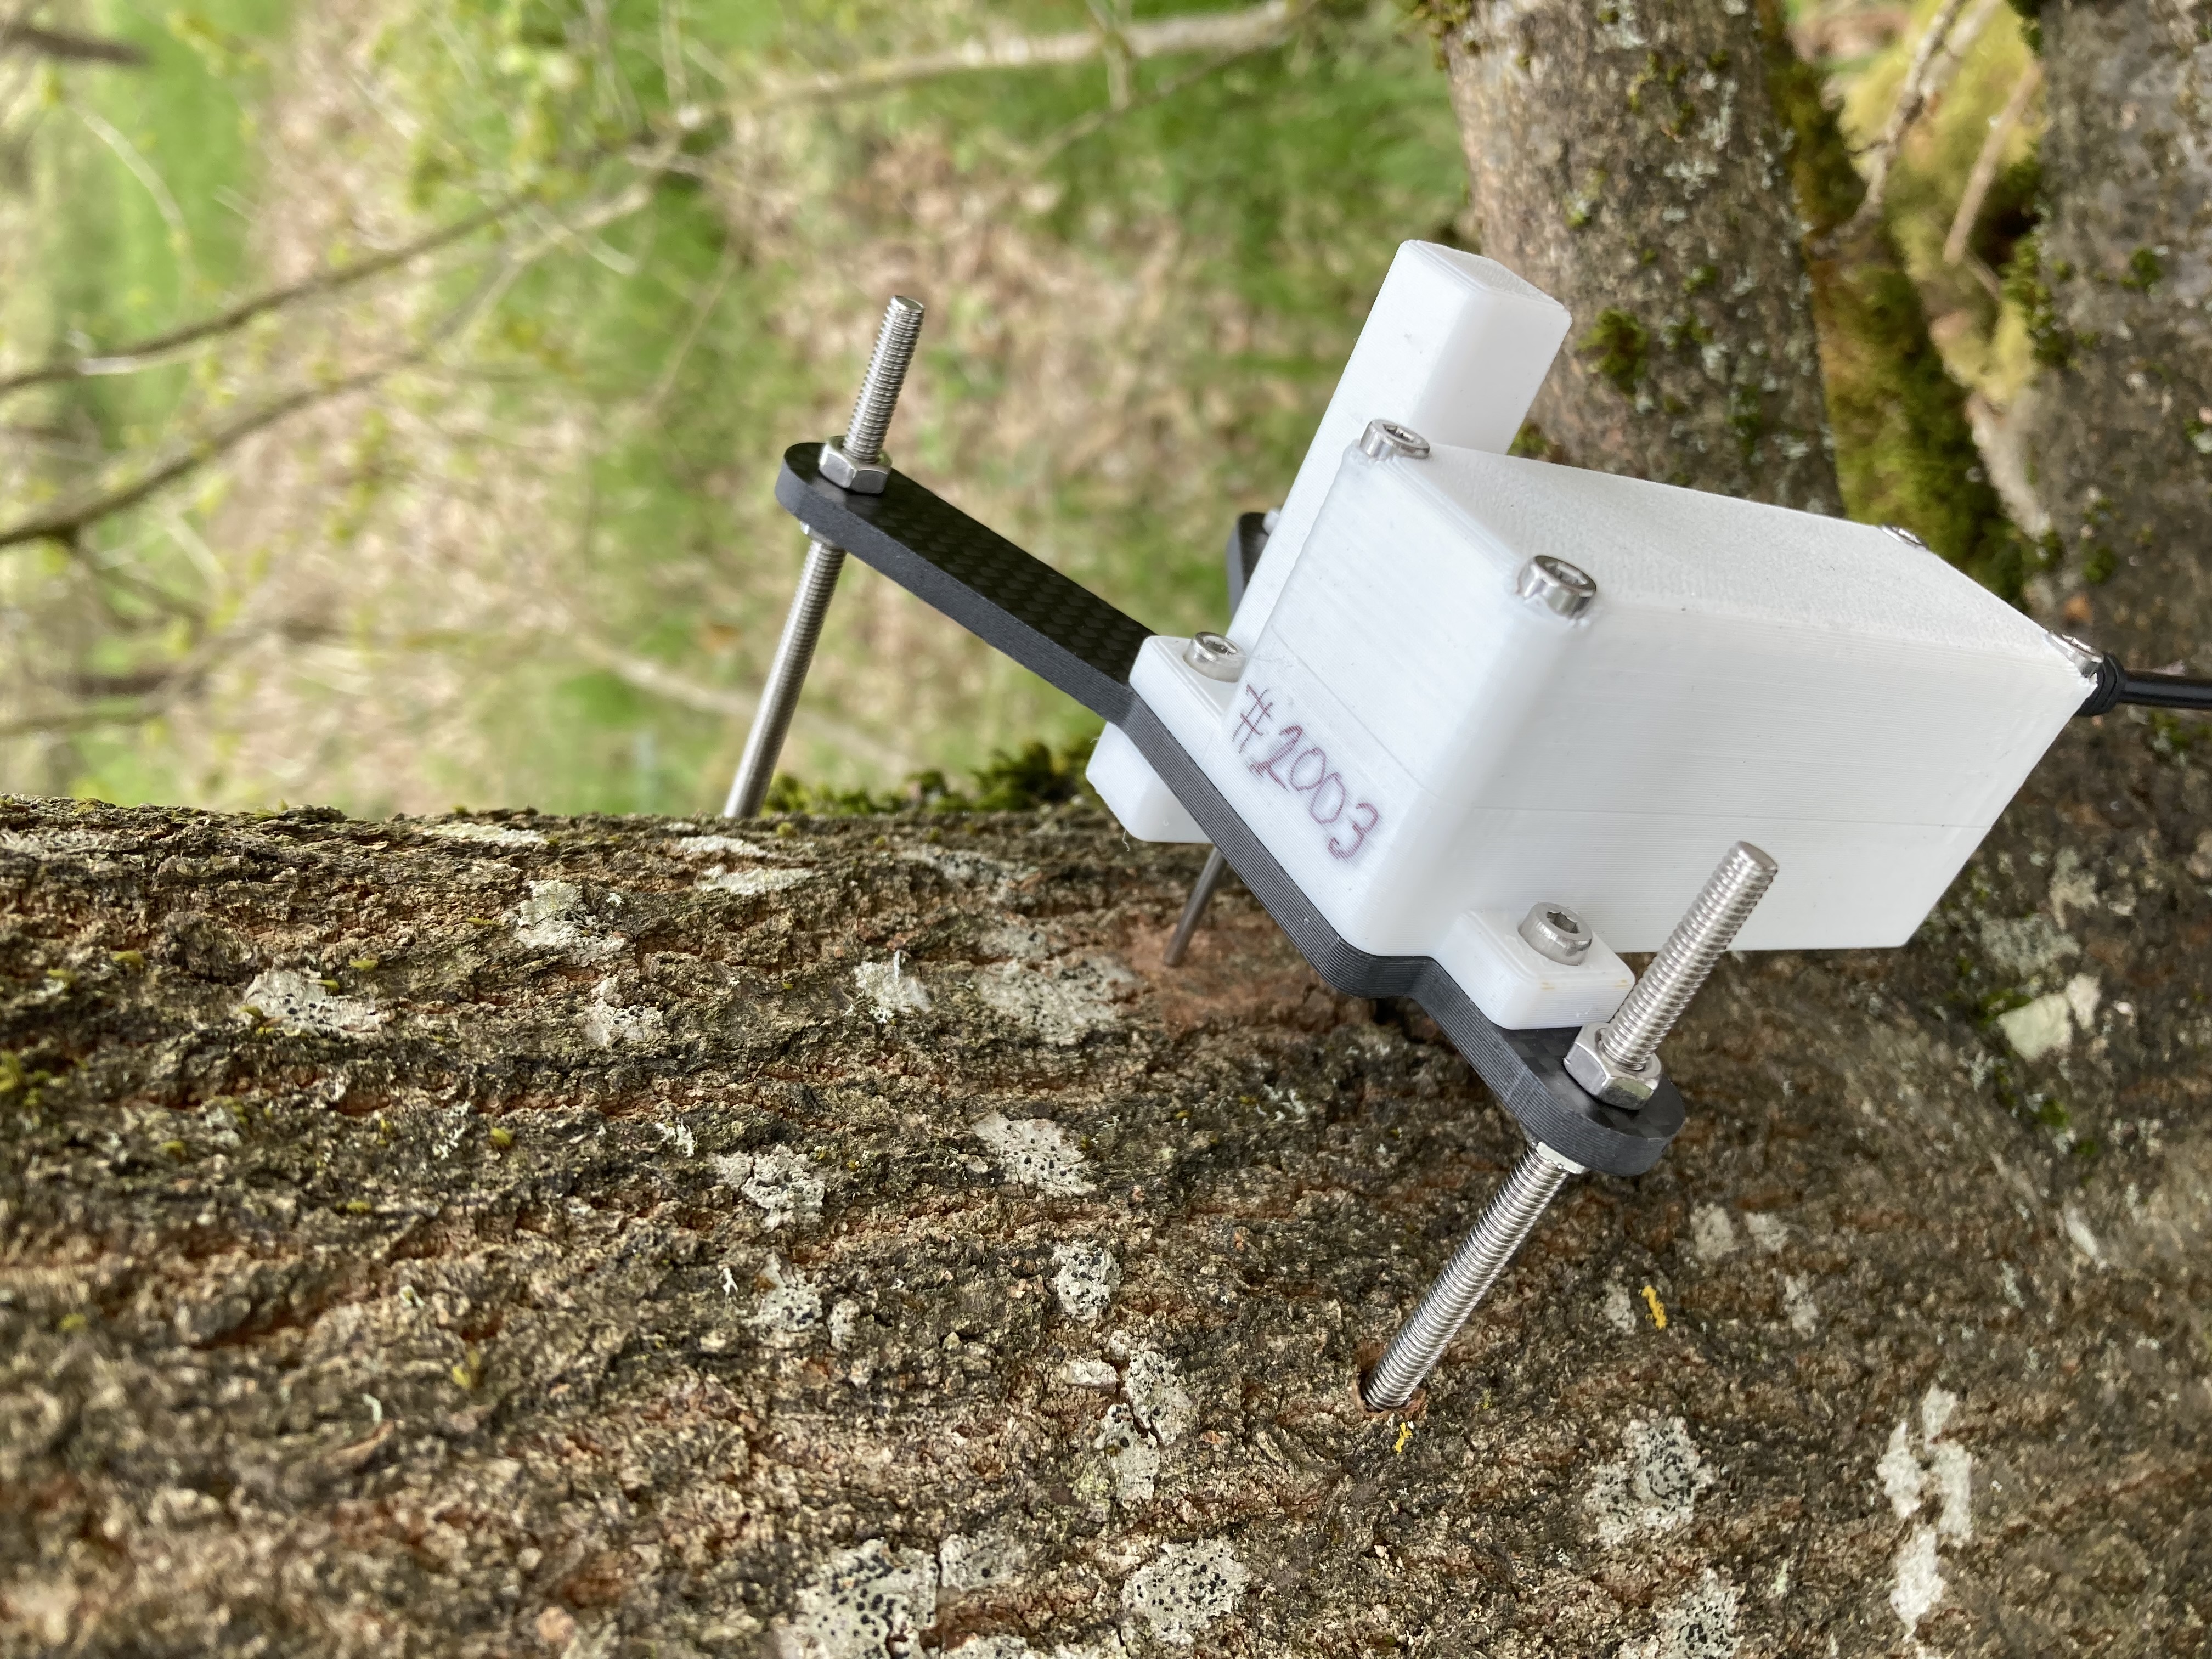
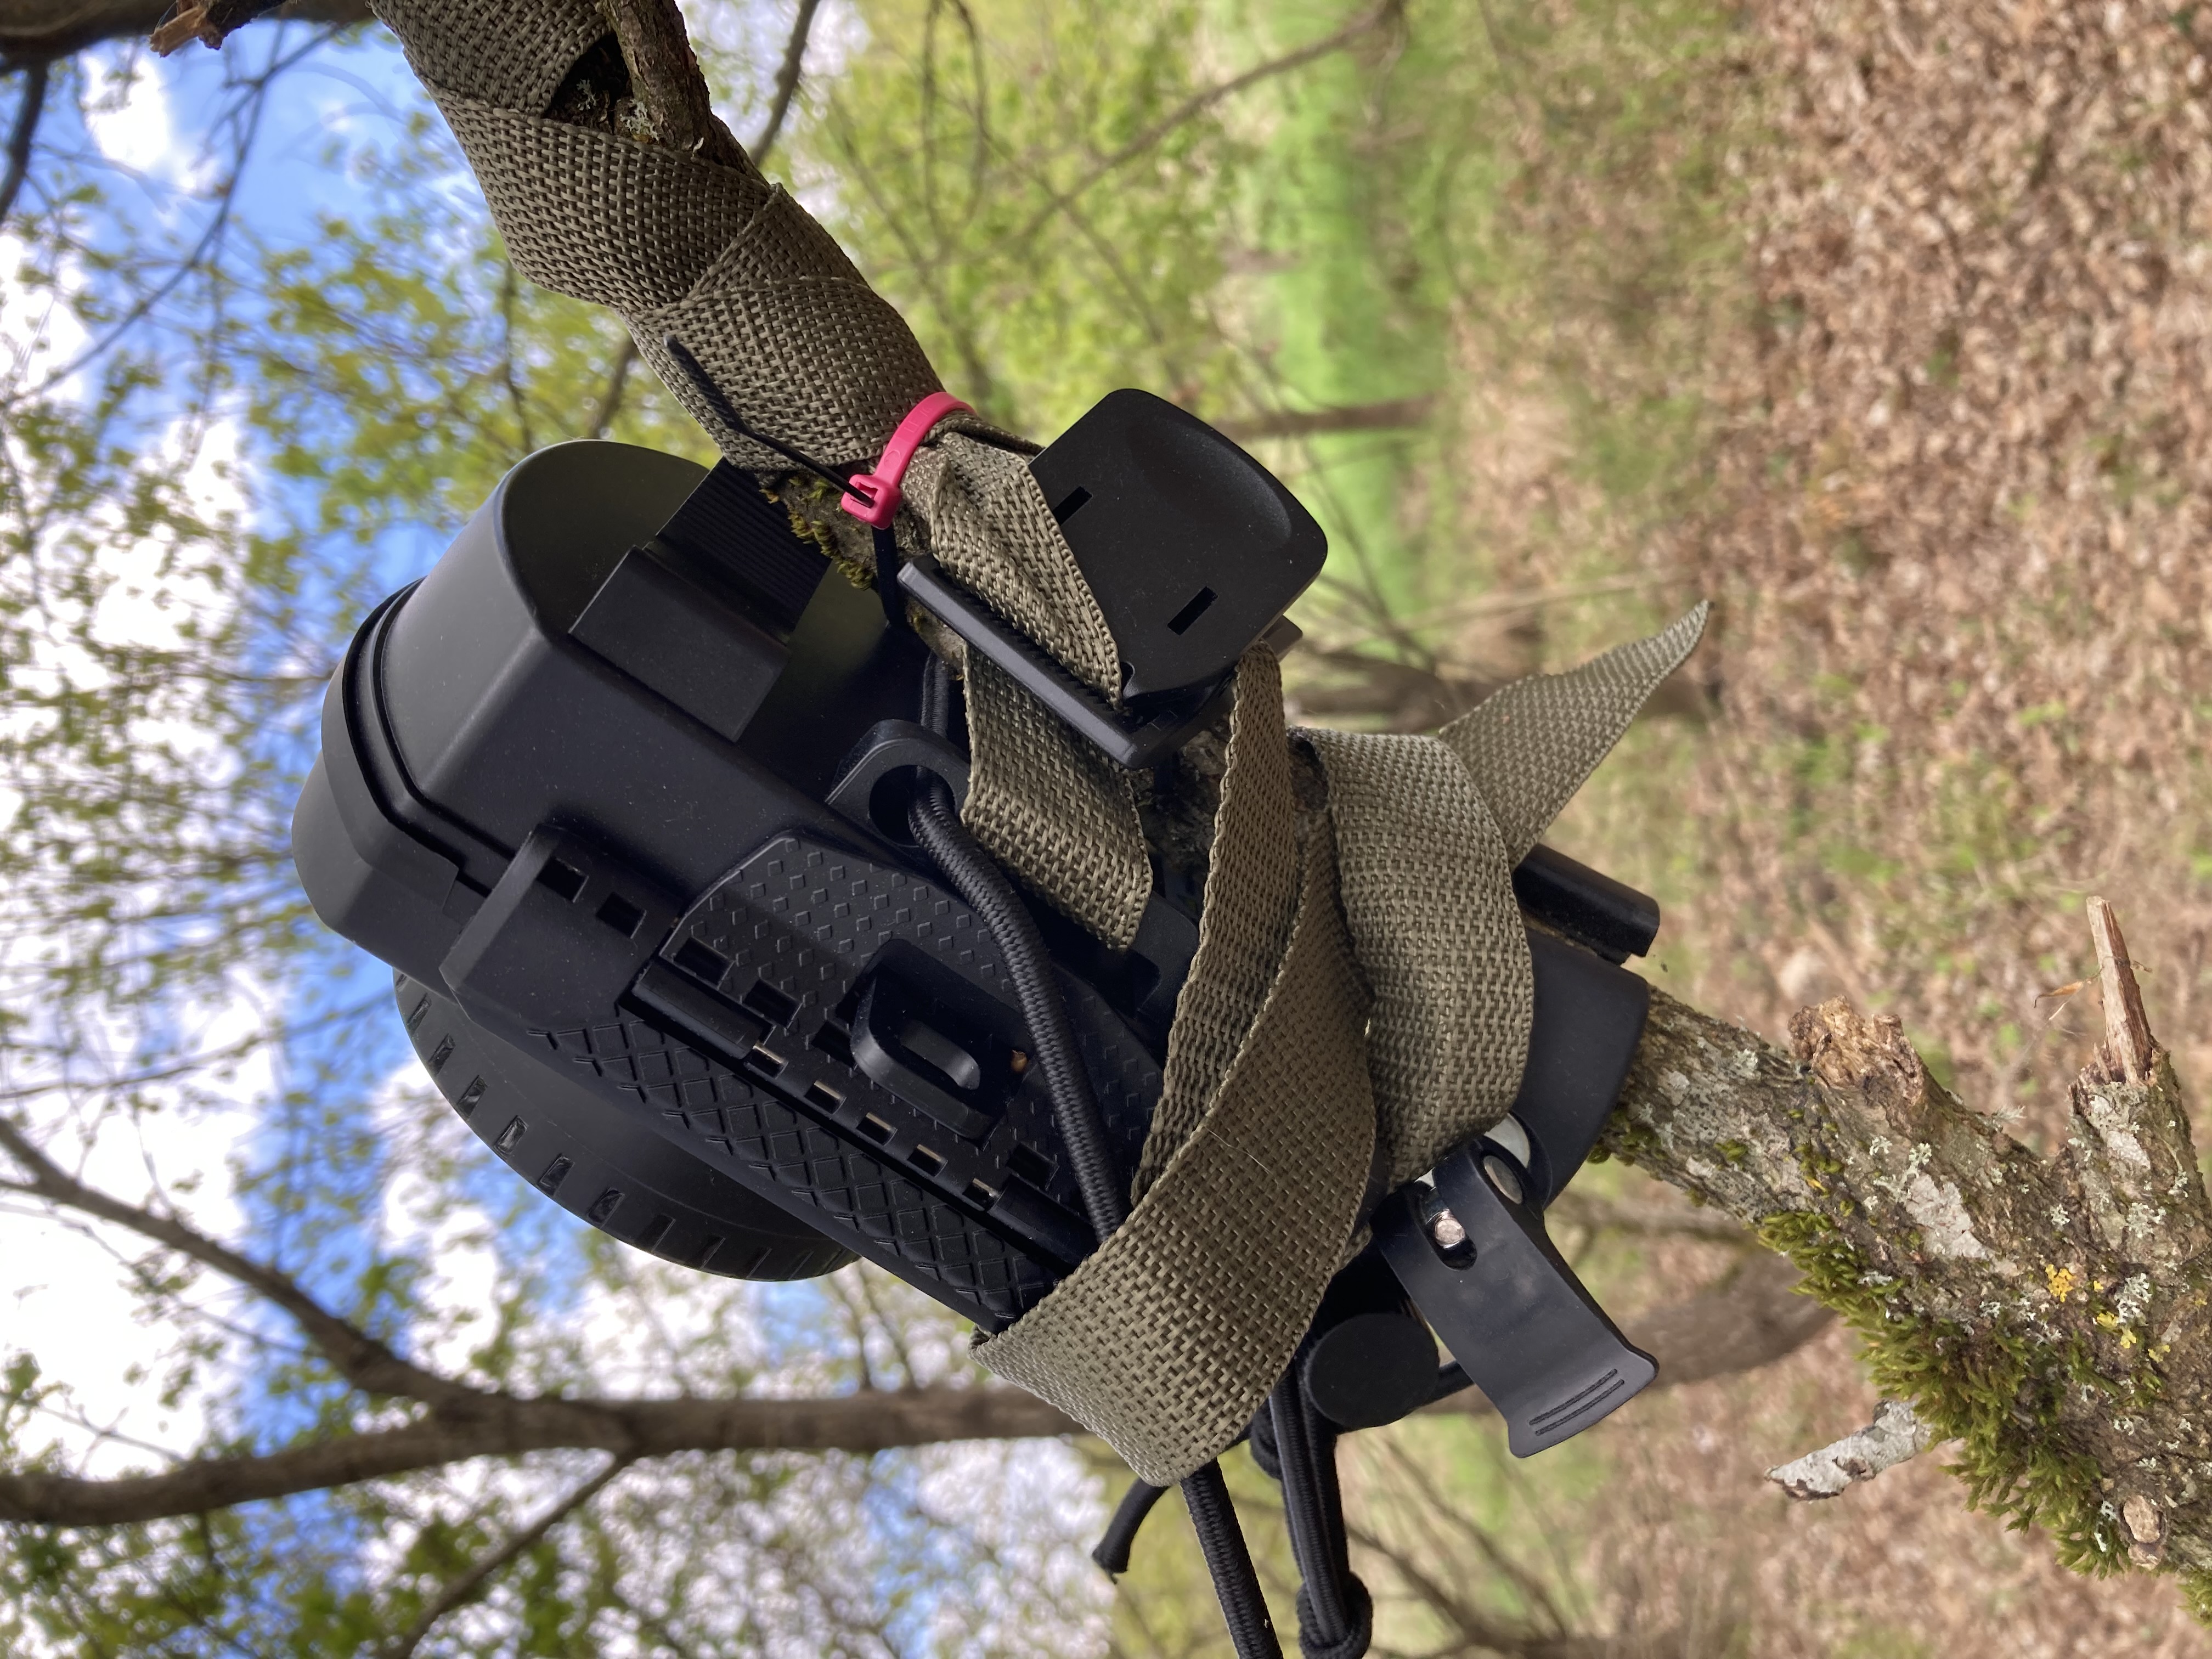
Automated Dendrometers
Even when they seem still, trees are speaking.
With a tool called a point dendrometer, we can measure these tiny movements, down to fractions of a millimeter. It’s like giving the tree a smartwatch that tracks its daily rhythms. At night, trees swell as they refill with water. During the day, they shrink slightly as they use that water for photosynthesis. This natural pulse tells us a lot. When a tree shrinks more than usual, it could be a sign of drought stress.
By tracking this daily cycle, we can spot which trees are struggling, and which are thriving. That helps us understand how planting density, soil conditions, and climate affect forest health and how to design oak forests that are more resilient in the face of climate change.
Explore the Dendrometer with our new interactive app here.
Tree Size Determination
Small changes in size, big insights for the future.
Every 3 to 5 years, we measure the height and diameter at breast height (DBH) of trees across our network, with millimeter accuracy. Together with crown size, these measurements form a tree’s allometry, revealing how it grows and stores carbon over time.
This work takes us to sites across the region and provides essential data for understanding the carbon balance of our forests. It’s detailed, hands-on science — helping us track forest health and resilience in a changing climate.
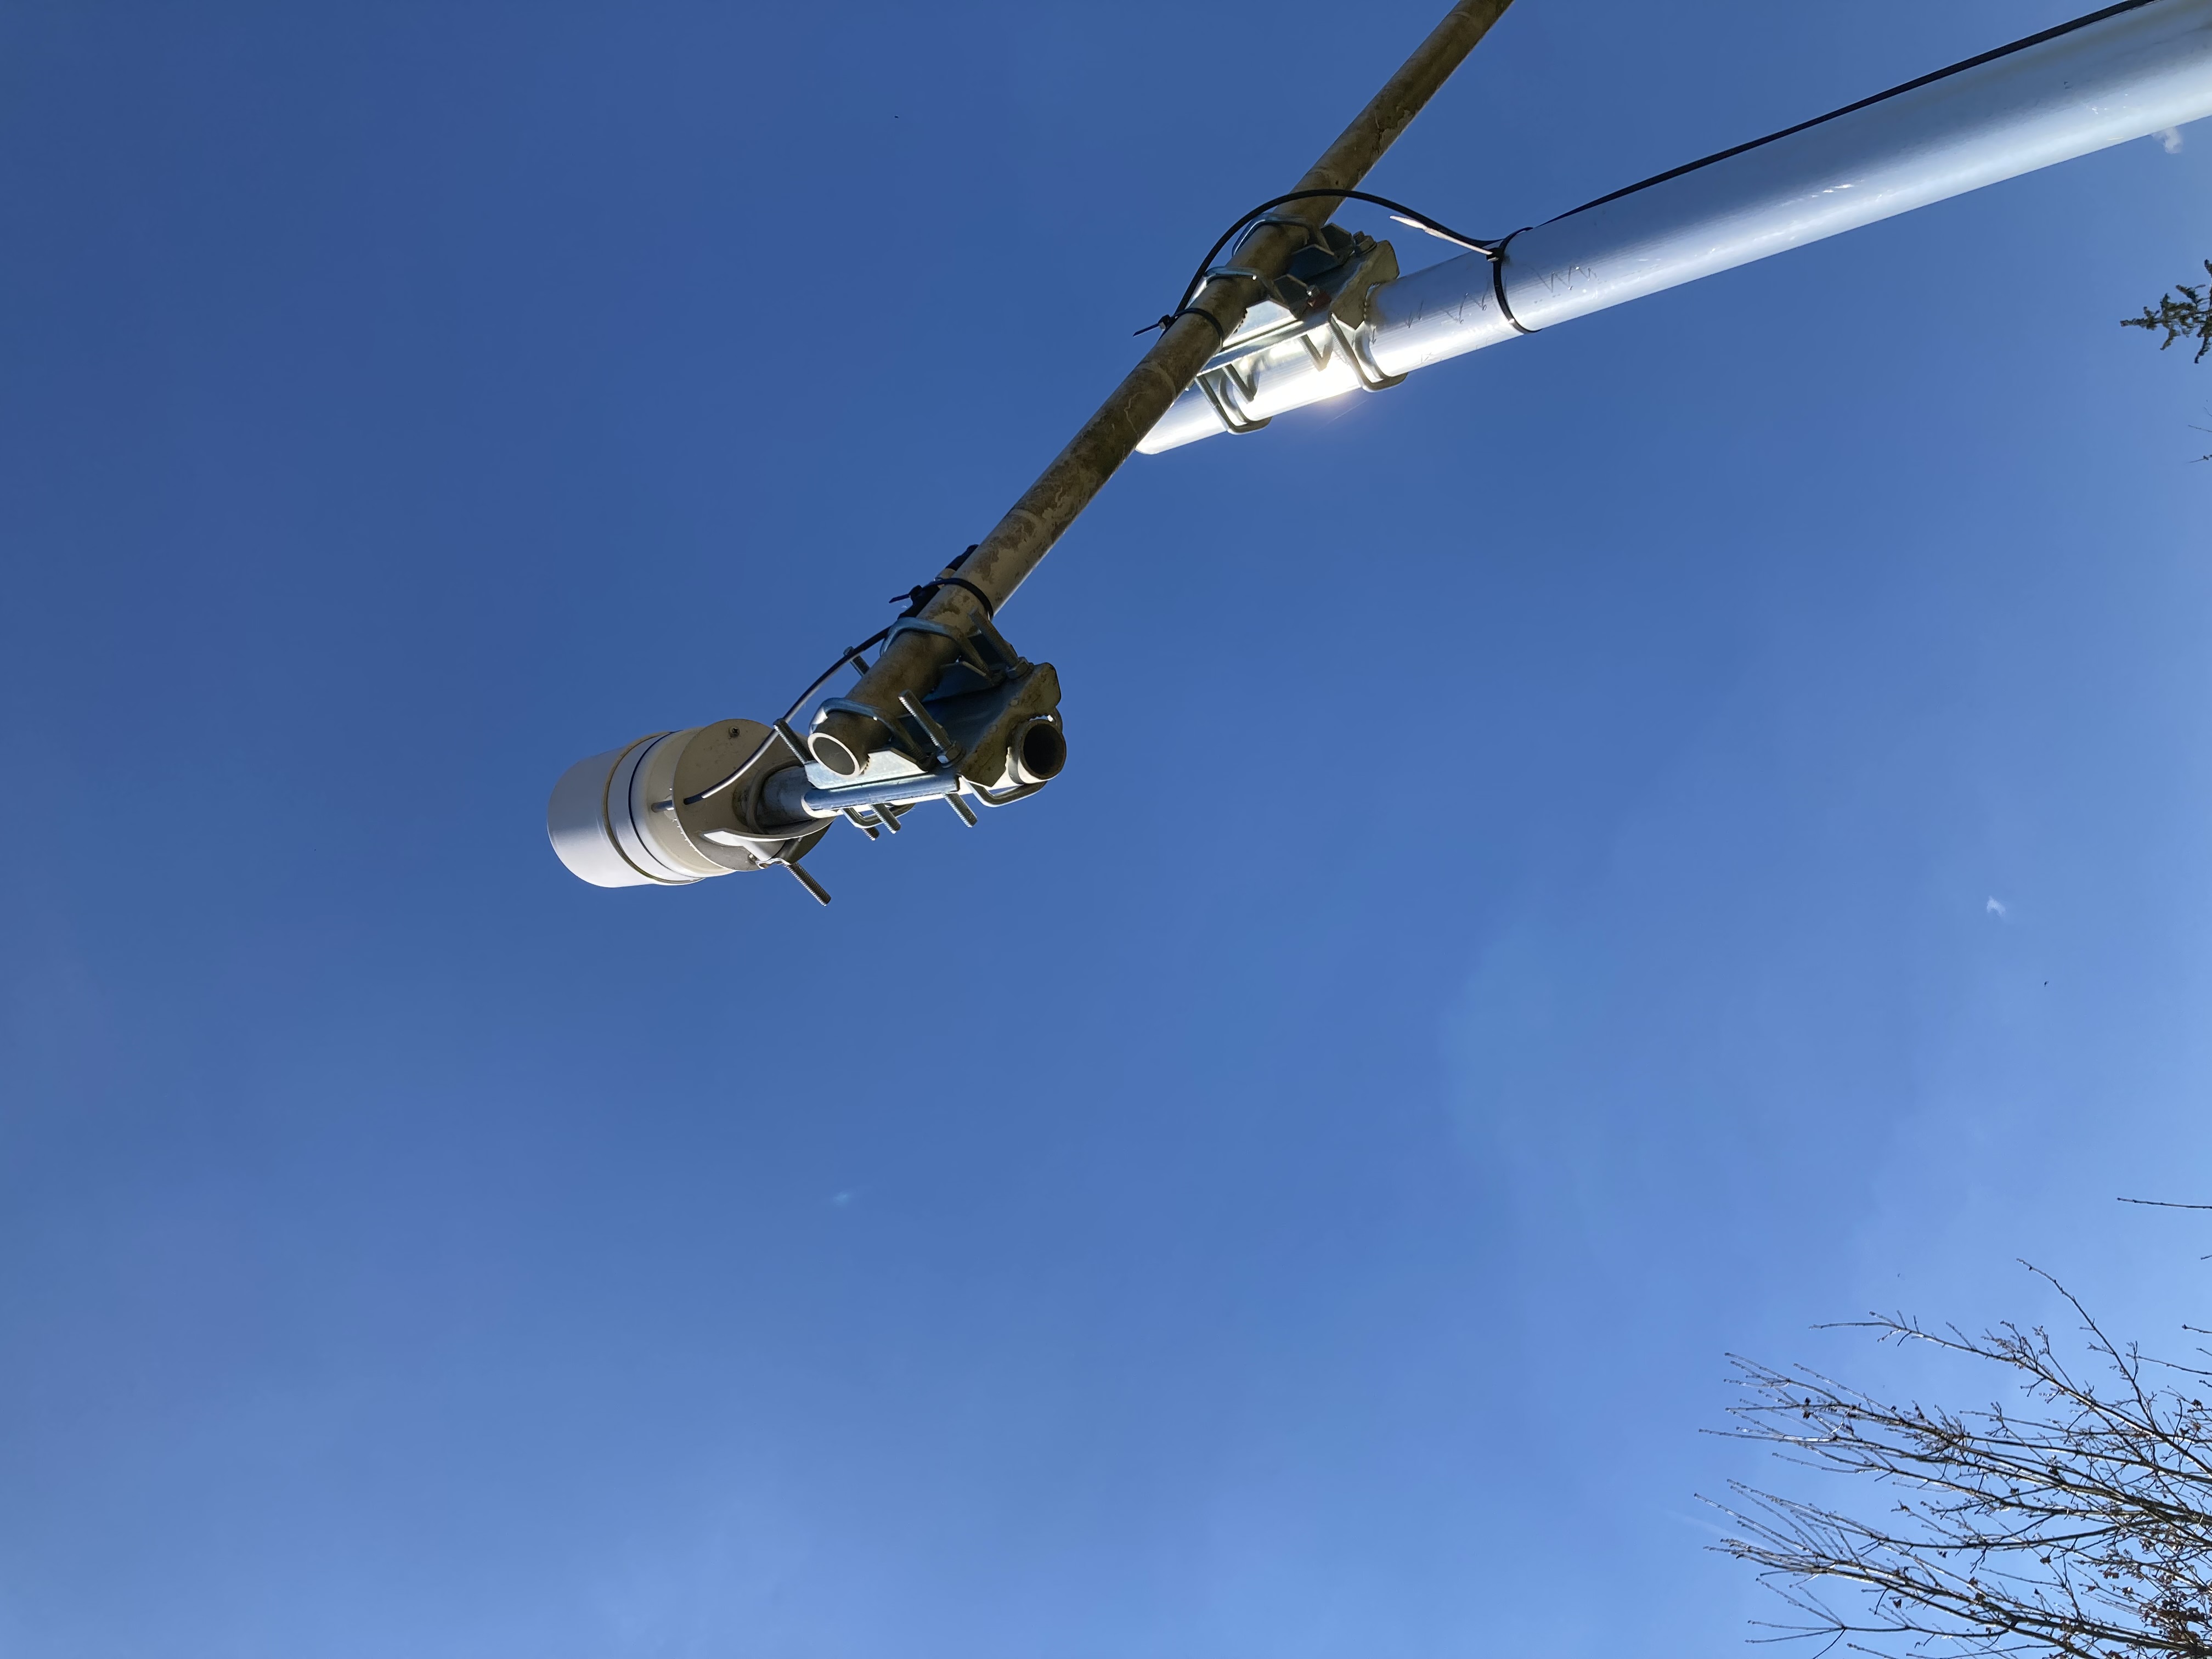
Climate Recording
Minute by minute, we’re capturing the forest’s changing climate.
At each of our sites, climate stations record key environmental conditions every 10 minutes. They measure temperature, humidity, solar radiation, and soil moisture — giving us a high-resolution picture of what the trees are experiencing.
These data are essential to understand how dry or hot it was at any given moment, and how trees respond. By linking climate conditions with tree growth, we can detect early signs of drought stress and better predict which trees and planting setups are most resilient.
You can do this link now by yourself and find out, how temperature and humidity drive a trees daily shrinking and swelling. Explore it right here.
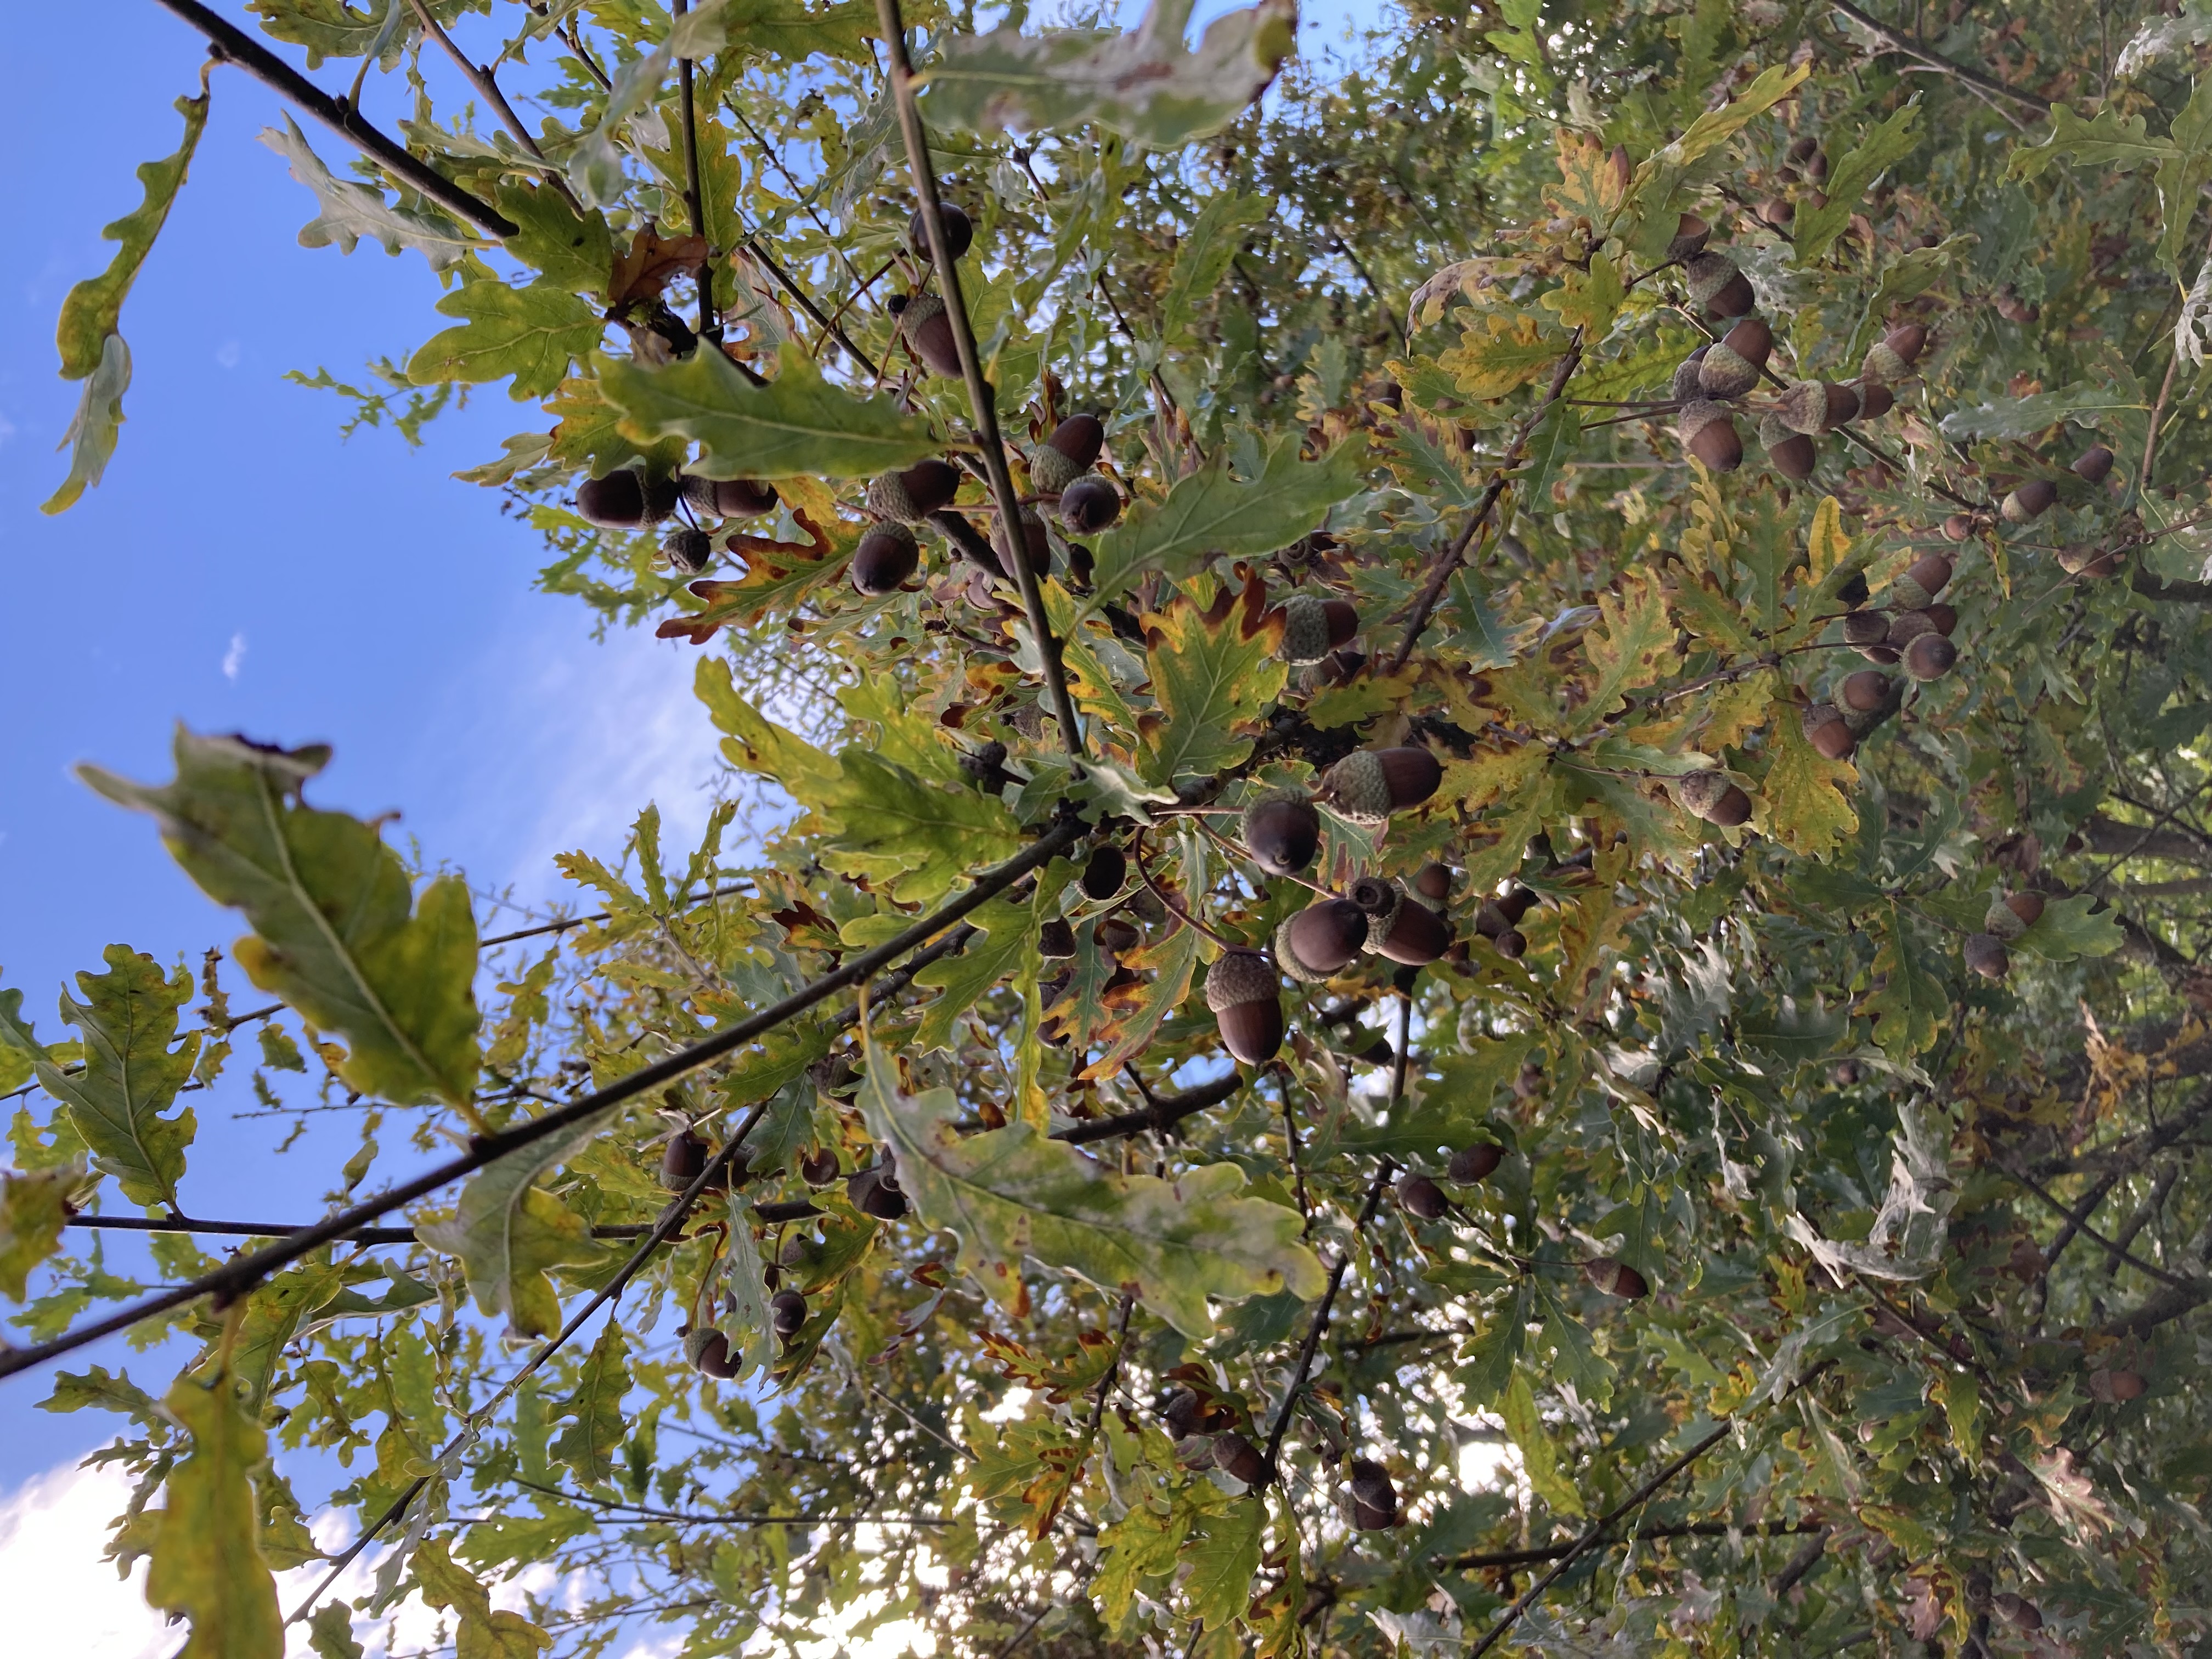
Counting Acorns
Healthy reproduction means forests that can renew themselves in a drying world.
Every year, we head into the forest, often with the help of volunteers, to estimate how many acorns each oak tree produces. This process, known as fructification monitoring, helps us understand how climate and planting density affect a tree’s ability to reproduce.
Acorn production isn’t just about seeds — it’s a window into tree health and resilience. Years with few or no acorns can signal stress, while consistent reproduction points to stability. Tracking this over time is key to predicting how forests will regenerate and adapt under future climate conditions.
Tracking Seasonal Changes
Because in every leaf that opens or falls, there’s a message about our changing climate.
At our sites, cameras are installed not on the forest floor, but pointed up, into the crowns of the oak trees. These upward-facing cameras capture the phenological cycle of the forest: when leaves flush in spring and when they fall in autumn.
By monitoring these seasonal changes year after year, we can detect shifts in timing that may be linked to climate change. Are leaves emerging earlier? Falling later? And how does this differ between dense and open plantings? These observations help us understand how tree life cycles respond to environmental cues and how forests may adapt in a warmer, drier future.
Coming Soon: Live and Interactive Data Visualization
We’re currently developing sensors of the second generation, which will be equipped with long range transmitting chips to establish a LoRaWAN network which will allow to explore Live data from our Nelder experimental plots. From growth patterns to environmental responses, this platform will let you dive into the dynamics of tree development like never before.
Stay tuned — forest data is about to come to life!